Parallel visual circuitry in a basal chordate
- University of California, Santa Barbara, United States
Abstract
Results
Glutamatergic and GABAergic photoreceptors
Posterior brain vesicle relay neurons are mixed VGAT- and VACHT-expressing
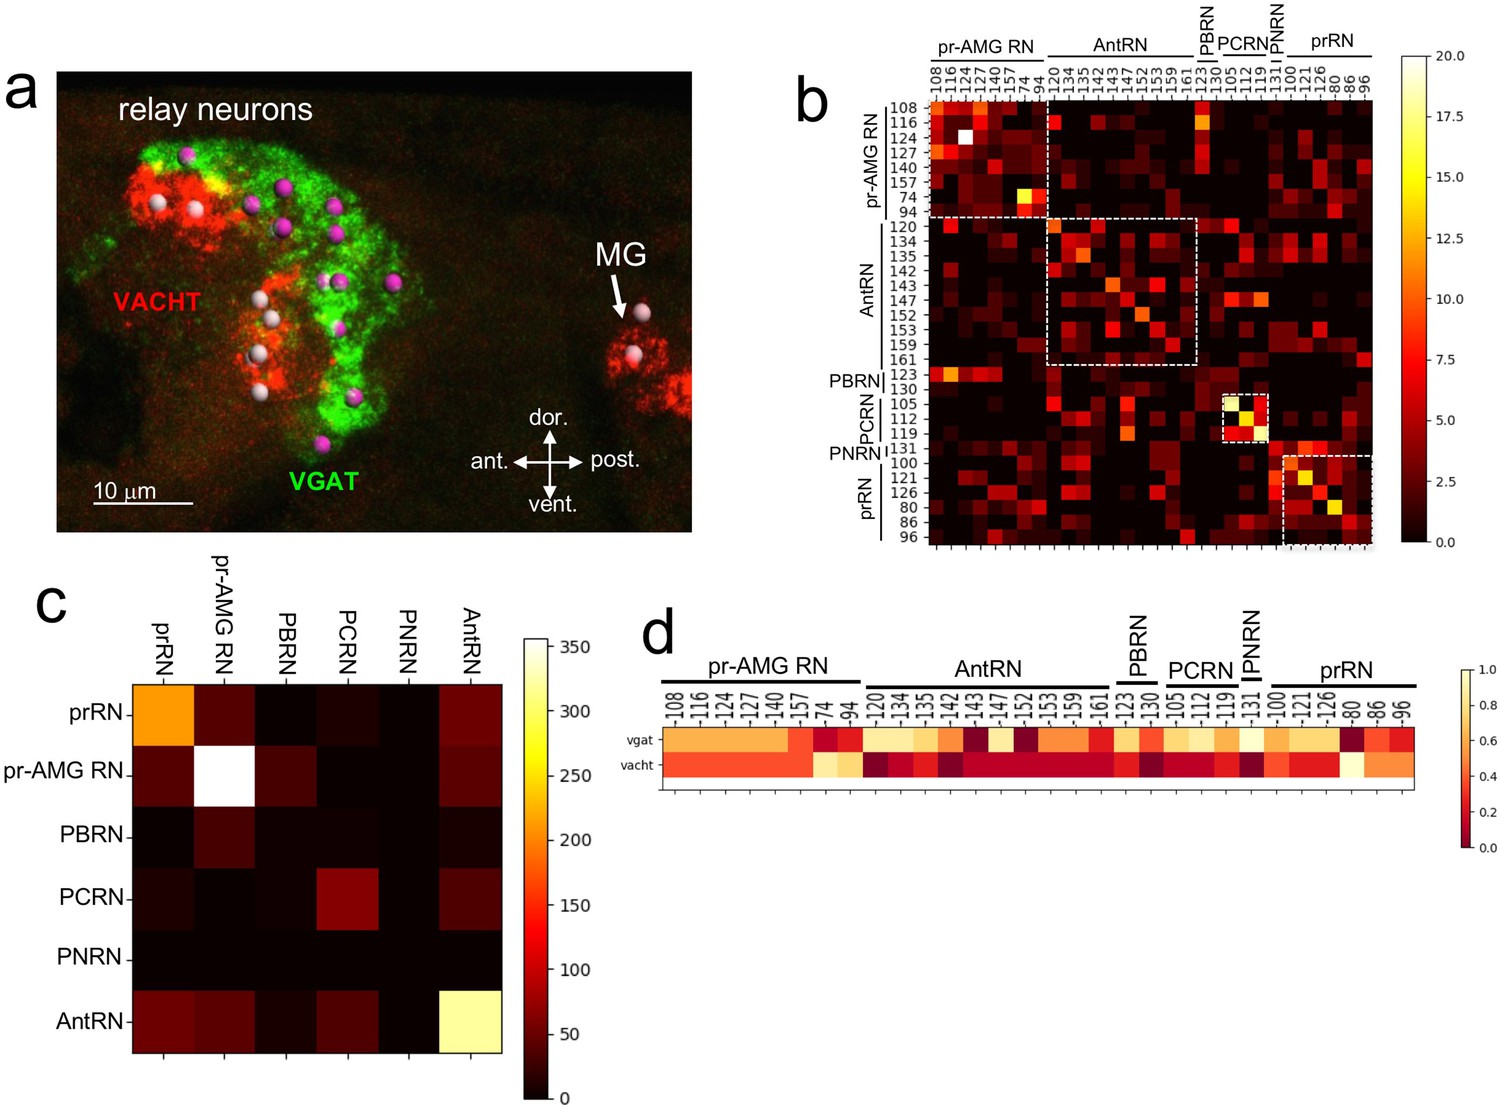
Sensory input from the photoreceptors, antenna cells, coronet cells, bipolar tail neurons and a subset of peripheral neurons is directed to a cluster of ~30 RNs in the pBV. These RNs in turn extend axons through the neck to the MG. Among this cluster are the six prRNs and eight pr-AMG RNs (Figure 1; (Ryan et al., 2016)). Previous in situ hybridization studies identified VGAT- and VACHT-expressing neurons in the appropriate place in the BV to be RNs (Yoshida et al., 2004). Moreover, these neurons project axons posteriorly to the MG, a defining characteristic of the pBV RNs. BV neurons expressing other major NTs, including glutamate, dopamine, and serotonin, are neither in the correct brain region to be RNs, nor do they project from the BV to the MG ([Horie et al., 2008b; Moret et al., 2005; Pennati et al., 2007], and our observations). By HCR in situ we observed that the pBV RNs cluster in two distinct groups along the anterior/posterior axis, with the anterior cluster expressing VACHT, and the posterior group expressing VGAT (Figure 3a). We observed an average of 16 (±1.6, n = 9 larvae) VGAT-positive neurons and 11 (±1, n = 8 larvae) VACHT-positive neurons.
Neurotransmitter use in the relay neurons.
(a) In situ hybridization of VGAT and VACHT to the relay neurons in the brain vesicle. Also visible is the anterior tip of the motor ganglion. Nuclei are shown as spheres. (b) Confusion matrix for relay neuron registration. (c) Confusion matrix for relay neurons grouped by type. (d) Heat map of neurotransmitter predictions from cell registration of relay neurons, with scale showing color by proportion of iterations predicting either VGAT or VACHT. Abbreviations: ant., anterior; post., posterior; dor., dorsal; vent., ventral; MG, motor ganglion; pr-AMG RN, photoreceptor ascending motor ganglion relay neuron; prRN, photoreceptor relay neuron; AntRN, antenna cell relay neuron; PBRN, photoreceptor-bipolar tail neuron relay neuron; PCRN, photoreceptor-coronet relay neuron; PNRN, peripheral relay neuron; VGAT, vesicular GABA transporter; VACHT, vesicular acetylcholine transporter.
Unlike the ocellus, the pBV RN cluster does not have obvious anatomical features, although the various classes of RNs are clustered, with, for example, the antenna cell RNs (AntRN) being posterior to the photoreceptor RNs (Figure 3—figure supplement 1; Ryan et al., 2016). However, given the diversity of RN types in the pBV it is unlikely that the expression domains of VGAT and VACHT precisely correspond to the clusters of RN classes. In order to make predictions of NT use in the RNs we used the same registration approach as with the photoreceptors (n = 7 VGAT/VACHT double in situ datasets, Figure 3—figure supplement 1). The confusion matrix for the RNs shows a lower level of convergence than for the PR-Is, suggesting that the cellular anatomy of the RN cluster is less structured than the ocellus (Figure 3b; Figure 3—figure supplement 1). However, the confusion matrix also shows that the RNs are most often confused for other RNs of the same class (white boxes in Figure 3b). This is most evident when the registration is performed not with single cells, but with pooled RNs of each class (Figure 3c), and is presumably a reflection of the clustering of RN classes in the pBV. Thus we can have higher confidence in the NT use by RN class than we can have in individual neuron identities. For example, the connectome shows the AntRNs are clustered at the rear of the BV (Figure 3—figure supplement 1; (Ryan et al., 2016)), as are the VGAT expressing neurons (Figure 3a; Figure 3—figure supplement 1). Accordingly, the registration predicts that eight of the ten AntRNs are VGAT positive (Figure 3c). For the present study, which focuses on the visuomotor pathway, the registration predicts that five of the eight pr-AMG RNs are VGAT expressing, two are VACHT expressing, and one (pr-AMG RN 157) cannot be resolved (no dual VGAT/VACHT expression was observed in the in situs). On the other hand, the registration predicts that the six prRNs are evenly mixed between VGAT and VACHT expression. These predictions provide starting points for experimental validation detailed below.
The motor ganglion contains a mixture of cholinergic and GABAergic neurons
The MG contains five left/right pairs of motor neurons, as well as several classes of interneurons, including six MGINs, seven AMGs, two ddNs, and two posterior MG interneurons (Ryan et al., 2016). Also described in the MG are two left/right pairs of decussating VGAT-positive neurons (Horie et al., 2009; Nishino et al., 2010). These are likely the same decussating MG neurons as described in the connectome, although the names are slightly different (anterior caudal inhibitory neurons (Horie et al., 2009) versus ascending contralateral inhibitory neurons (Ryan et al., 2016), both abbreviated as ACIN). However, the connectome reports only three ACINs, with the anterior ACIN not paired. It was speculated that this was an anomalous feature of the particular larva used for the ssEM. Supporting this, a second larva being analyzed by ssEM for connectomics shows two pairs of ACINs (K. Ryan, personal communication).
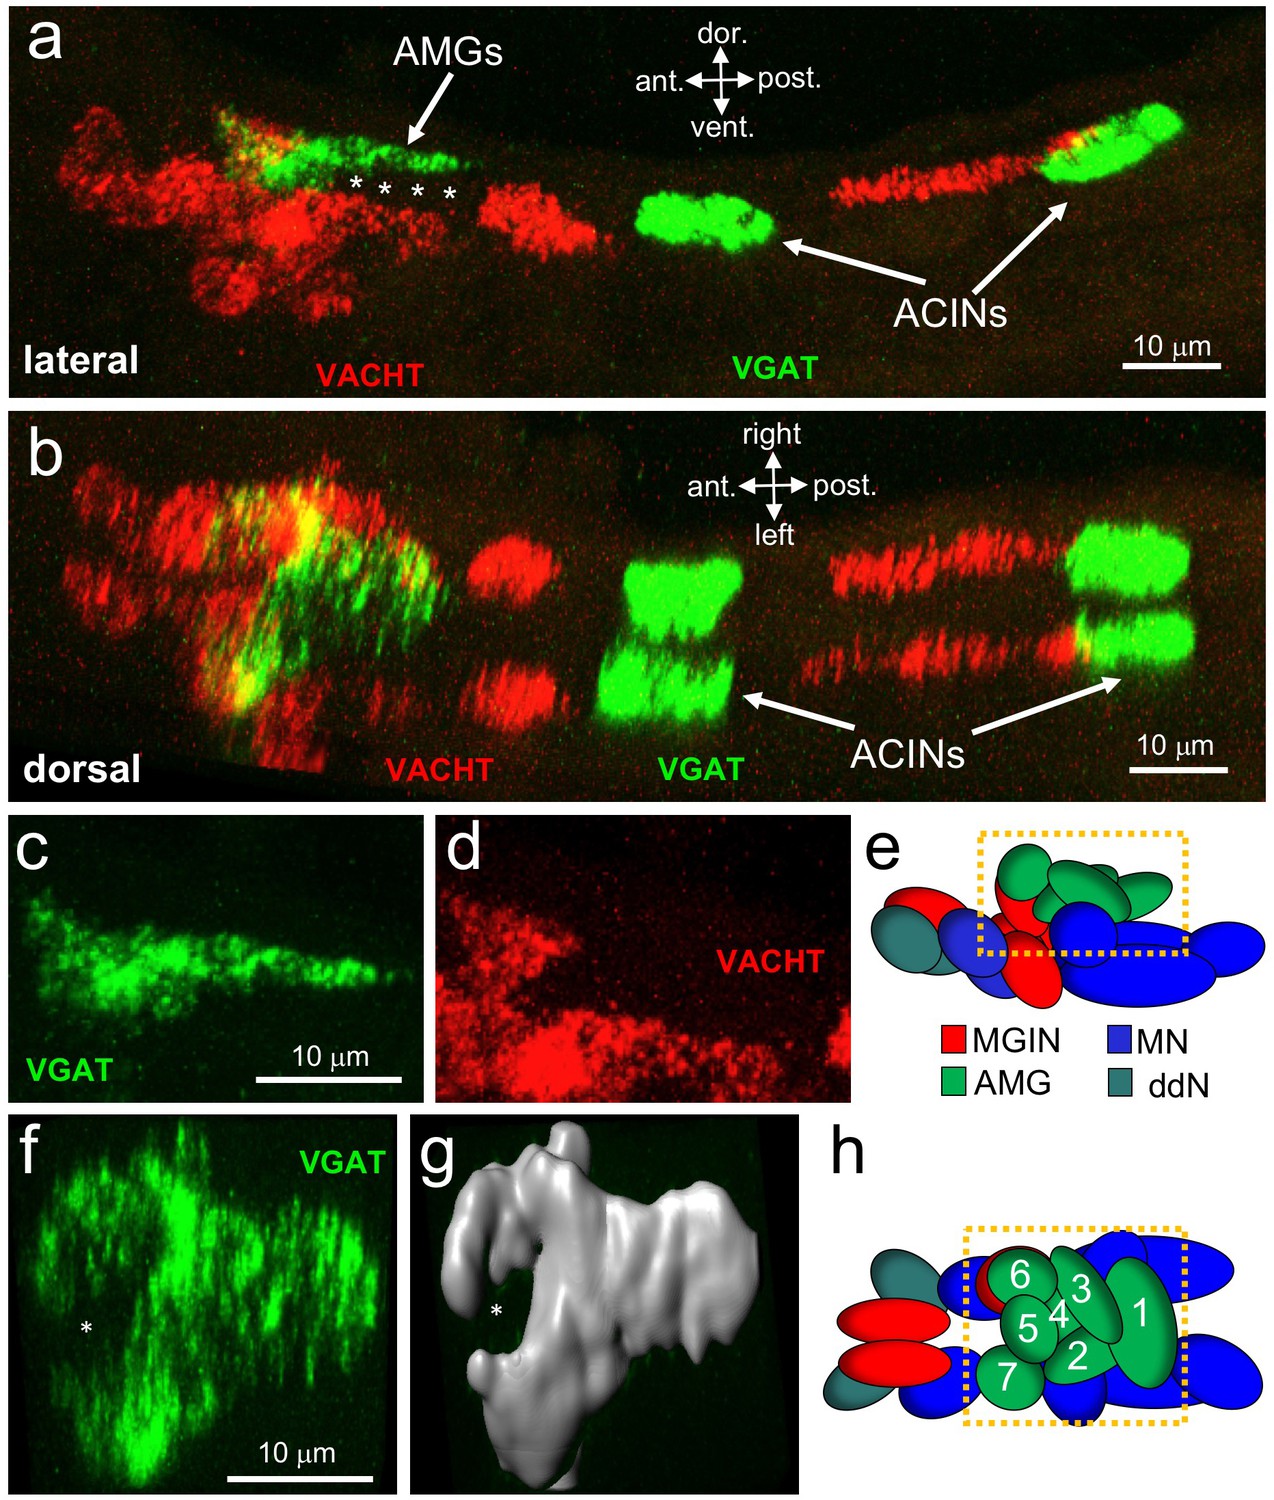
Like the ocellus, the MG has a well-defined anterior-to-posterior and dorsal-to-ventral cellular anatomy (Figure 4a and b; Ryan et al., 2016; Ryan et al., 2018). Neurotransmitter use by some MG neurons is already documented, including the motor neurons, which are cholinergic (Takamura et al., 2010; Takamura et al., 2002), and the ACINs which are glycinergic (Nishino et al., 2010). By HCR in situ hybridization we observed VGAT- and VACHT-positive neurons in the MG (Figure 4b), but no VGLUT- or TH-positive cells (data not shown). These results are consistent with previous studies (Horie et al., 2008b; Moret et al., 2005). Likewise it was reported that no serotonergic cells were present in the MG (Pennati et al., 2007). As with the RNs, the VGAT- and VACHT-expressing neurons in the MG are segregated anatomically. We also found a population of 6–7 cells between the AMGs and the MNs (asterisks in Figure 4a), that were not annotated in the connectome as neurons and that failed to label with any of our NT markers. We hypothesize that these are ependymal cells, which are abundant in the nerve cord immediately caudal to this region.
Neurotransmitter use in the motor ganglion.
(a and b) Expression of VGAT and VACHT by in situ hybridization in the motor ganglion, lateral (a) and dorsal (b) views. Asterisks indicate predicted ependymal cells. (c) Lateral view of VGAT expression in the AMGs. (d) shows same view as c, but with VACHT expression. (e) Diagram of neurons in the motor ganglion (derived from Figure 1 of Ryan et al., 2017). Box indicates approximate positions of panels c and d. Lateral view; anterior is to the left. (f) Dorsal view of VGAT expression in the AMGs. Asterisk indicates central non-VGAT expressing cell. (g) Three dimensional surface rendering of VGAT expressing cells in the AMGs. (h) Diagram of a dorsal view of the motor ganglion. AMG cells are numbered. Abbreviations: dor., dorsal; vent., ventral; ant., anterior; post., posterior; AMG, ascending motor ganglion neuron; MGIN, motor ganglion interneuron; ddN, descending decussating neurons; ACIN, ascending contralateral inhibitory neurons; MN, motor neuron; VGAT, vesicular GABA transporter; VACHT, vesicular acetylcholine transporter.
Because of the highly structured MG cellular anatomy, we can identify the various MG cell types in the in situ data. The anterior group of VGAT-positive cells is clustered dorsally in the MG, and correspond to AMGs (4 c, d and e; (Ryan et al., 2017)). In a dorsal view of the MG (Figure 4f,g and h) a ring of VGAT-positive cells was observed with a non-VGAT expressing cell in the center (asterisk, Figure 4f and g). The VGAT-expressing cells appear to be AMGs 1, 2, 3, 4, 6, and 7, while the central cell, which is instead positive for VACHT, appears to be AMG5. The connectome shows that AMG5 differs in its connectivity from the other AMGs. Significantly, AMG5 is the principle synaptic input for PNS neurons. It then synapses to the other AMGs, which in turn project their axons to other cells in the MG, including MGINs and MNs, as well as to the pr-AMG RNs in the BV. In the posterior of the MG we observed two pairs of VGAT-positive neurons, as described previously (Horie et al., 2009). Finally, in the ventral MG we observed a continuous block of VACHT expression that encompasses the anterior three pairs of MNs, the ddNs, and the MGINs. Similar in situ patterns were observed in most larvae (Figure 4—figure supplement 1), although the positions of the ACINs were offset in several (see larvae 5 and 6 in Figure 4—figure supplement 1), and one larva was observed to be missing both one motor neuron and one ACIN (larva 7in Figure 4—figure supplement 1), suggesting that MG variants, such as was observed in the animal used in the connectome study, may be relatively common.
Parallel visuomotor circuits
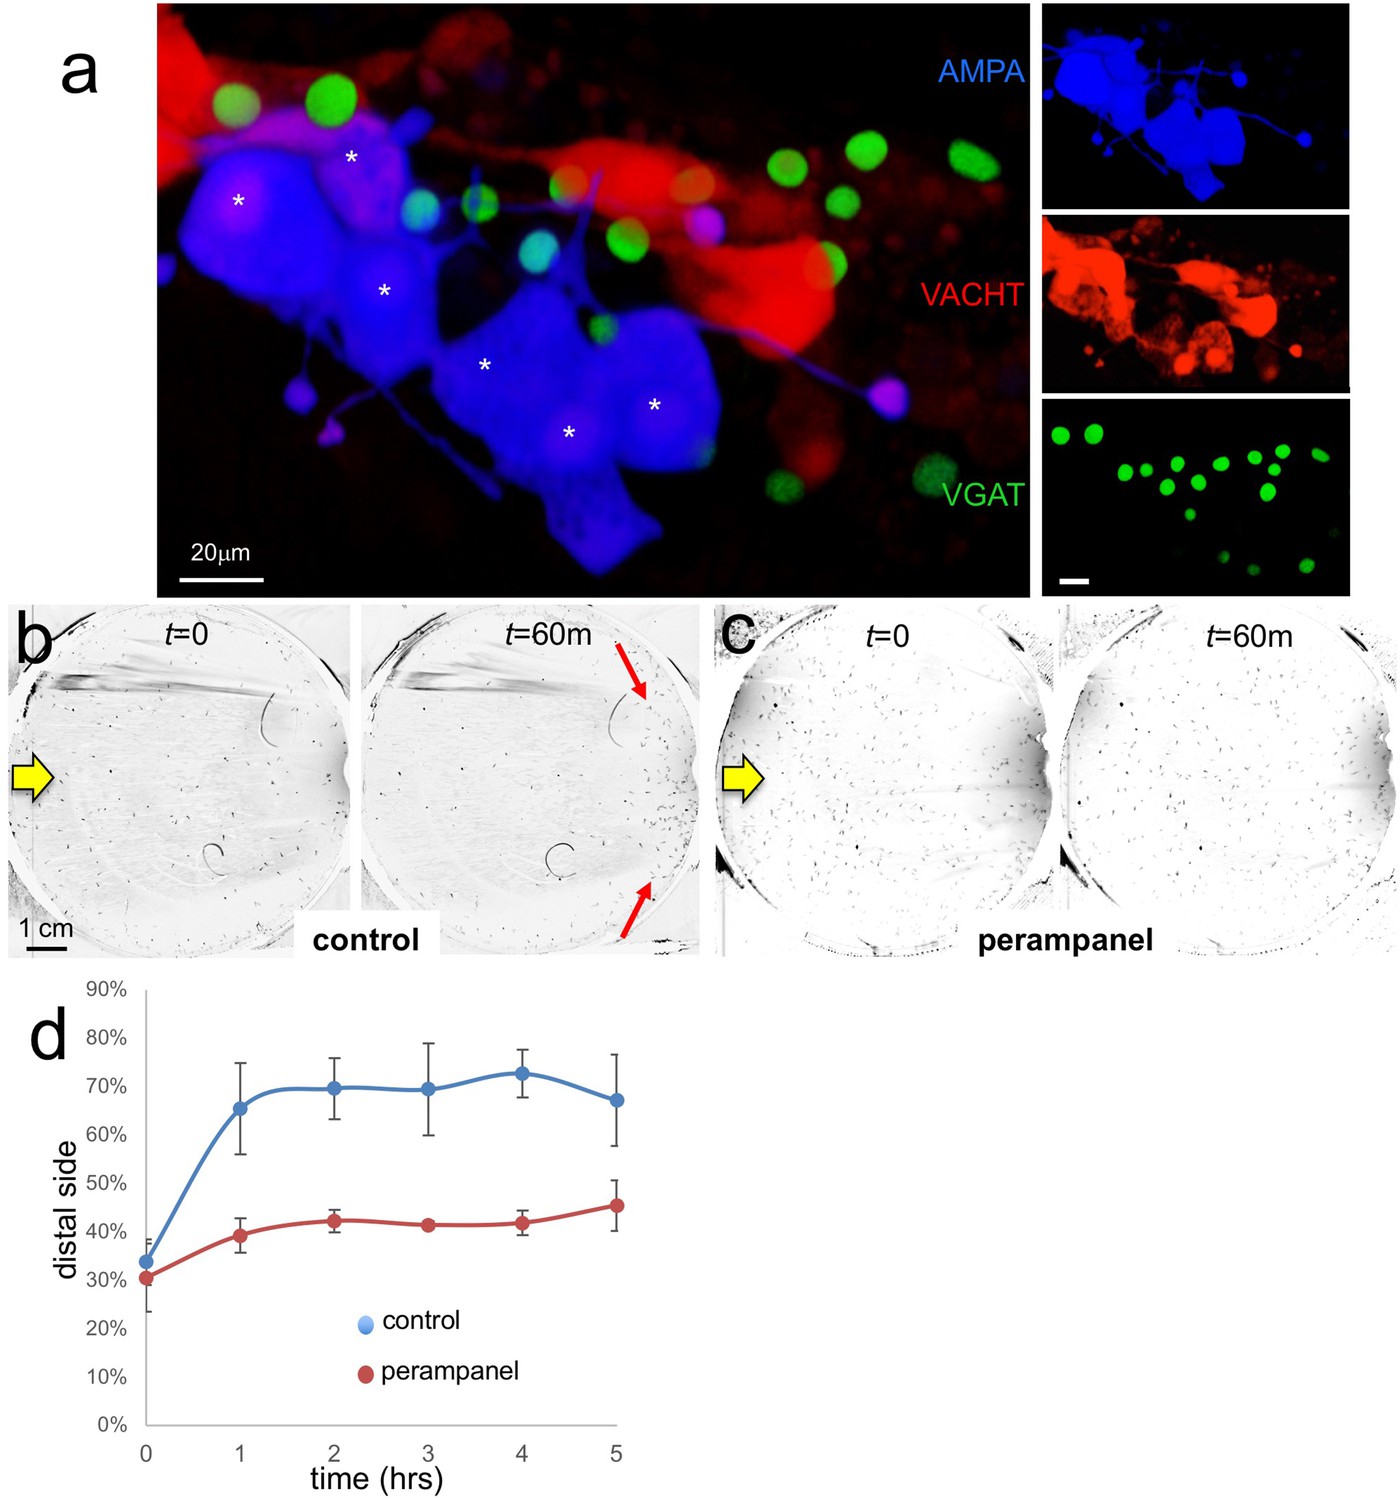
Our results indicate that the PR-Is, with the exception of two cells, are glutamatergic, while the PR-IIs are a mixture of GABAergic and GABA/glutamatergic. The Ciona genome contains a single glutamate AMPA receptor (AMPAR) (Okamura et al., 2005) that is expressed in larvae in the two antenna cells, and in a small cluster of neurons in the pBV (Hirai et al., 2017). Published results show that most of the pBV group of AMPAR-positive neurons are clustered at the ends of Arrestin-labeled photoreceptor axons, and that they extend their axons to the MG, suggesting they are photoreceptor RNs (see Figure 2B" in Hirai et al., 2017). We find that this pBV group is composed of ~6 cells (Figure 5—figure supplement 1). To investigate this further, we co-expressed an pAMPAR >GFP construct (Hirai et al., 2017) with pVACHT >CFP and pVGAT >nuclear RFP constructs. We observed coexpression of the AMPAR reporter in a subset of the VACHT-positive RNs, but never in the VGAT-expressing RNs (Figure 5a).
AMPA receptors in negative phototaxis.
(a) Coexpression of an AMPA-receptor and VACHT expression constructs in the relay neurons (white asterisks). The main panel shows the merge while smaller panels at right show single channels. (b) Negative phototaxis assay in control larvae. Yellow arrow indicates direction of 505 nm light. By 60 min (m) the majority of the larvae have swum to the side of the dish away from the light (red arrow). (c) Perampanel-treated larvae do not show negative phototaxis. (d) Quantification of negative phototaxis in control and perampanel-treated larvae. Points indicate the averages from three independent assays, ±standard deviation. Y-axis represents the percentage of larvae found on the side away from the light source (distal third). Abbreviations: VGAT, vesicular GABA transporter; VACHT, vesicular acetylcholine transporter.
To assess the function of the AMPAR-positive cells in Ciona visuomotor behaviors we used the non-competitive AMPAR antagonist perampanel (Hanada et al., 2011). For the assay, larvae were treated at 25 hr post fertilization (hpf) with perampanel in sea water and compared to vehicle-treated control larvae for both negative phototaxis and response to light dimming. The negative phototaxis assay consisted of placing the larvae in a 10 cm petri dish of sea water with a 505 nm LED lamp placed to one side (described by us previously Salas et al., 2018). Images were collected at 1 min intervals over 5 hr to assess for taxis (Video 1). Figure 5b and c show representative frames from the time-lapse capture at the start and at 60 min for control and perampanel-treated larvae, respectively. In the control sample the larvae at 60 min were observed to cluster at the side of the petri dish away from the light (distal side; red arrows in Figure 5b). By contrast no taxis was observed in the perampanel treated larvae (Figure 5c). Combined results from three independent assays (n = 129–365 larvae per group) are shown in Figure 5d and presented as the percent of larvae found on distal third of the petri dish. For control larvae ~ 70% swam to the distal third within 1 hr, while the perampanel-treated larvae remained evenly distributed across the dish.
Negative phototaxis of control and perampanel-treated Ciona larvae in 10 cm petri dishes.
Directional 505 nm illumination is from the left. Frames were taken at 1 per minute over five hours. In the video the 5 hr is compressed to 15 s (i.e., 1200X normal speed). Black and white tones were inverted to make the larvae more visible.
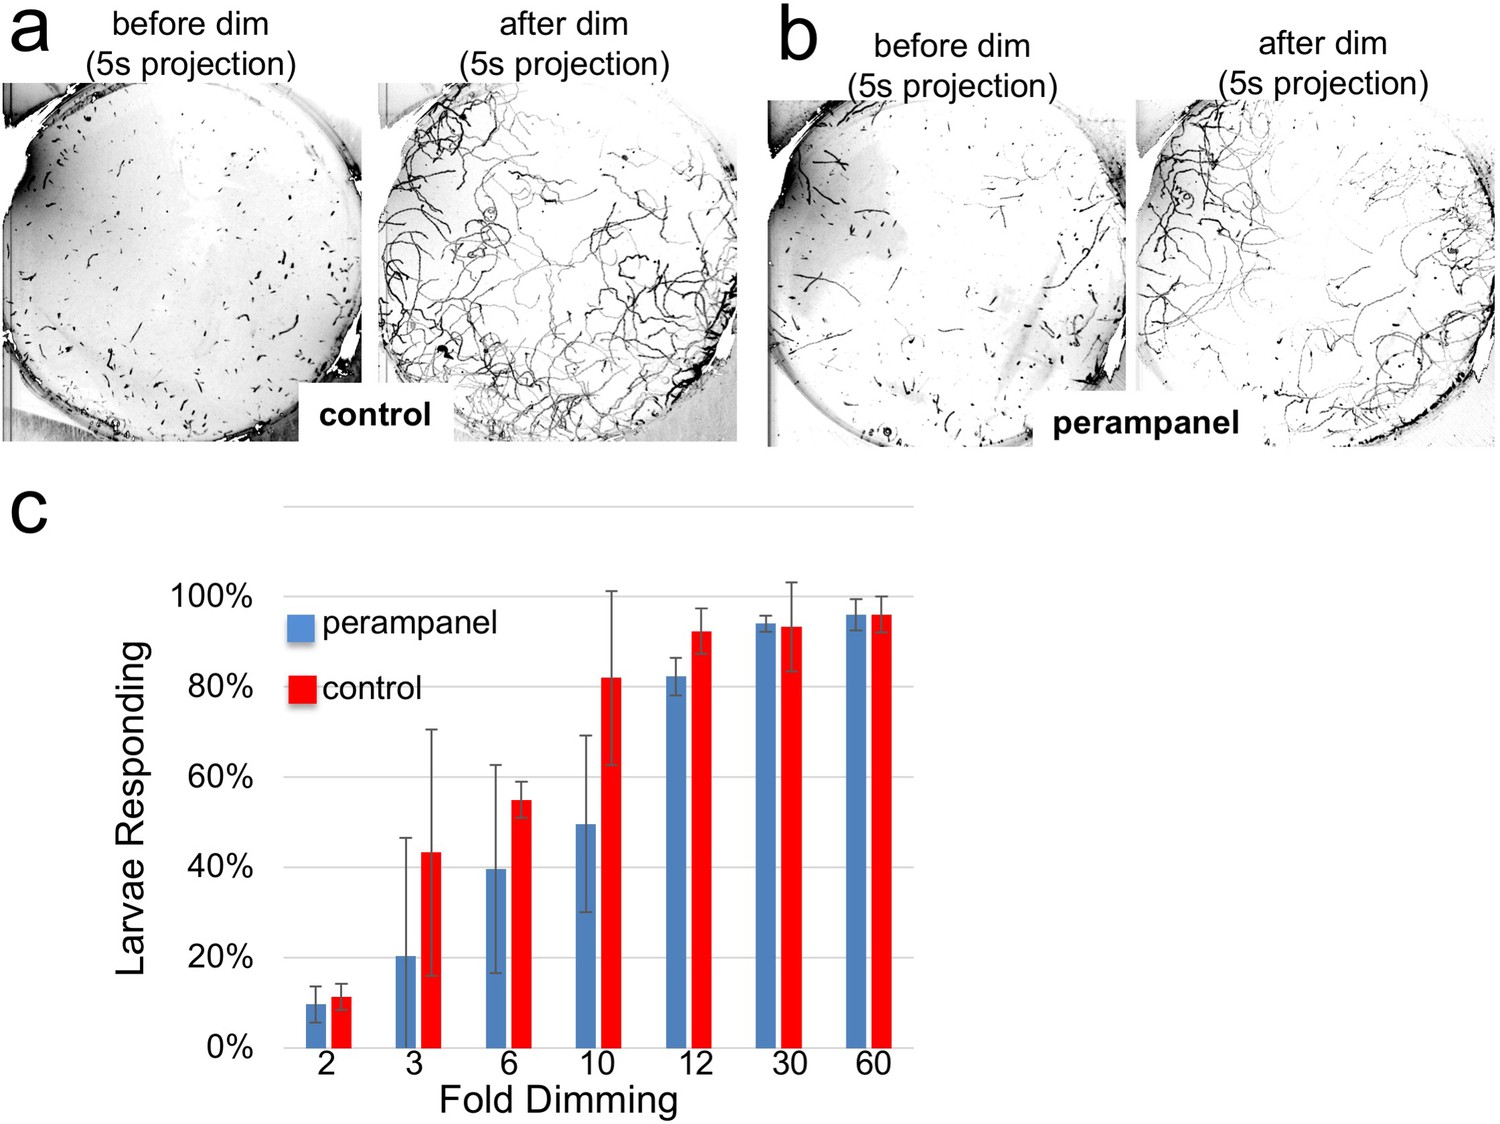
The inability of the perampanel-treated larvae to undergo phototaxis was not the result of an inability to swim, as seen in Video 2 which was taken at 8.9 fps, with and without perampanel. Moreover, we observed that perampanel treatment had no effect on the light dimming response (Video 3). Figure 6a and b show 5 s projection images from Video 3 immediately before and after dimming. In these images swims appear as lines, and the responses in control and perampanel-treated larvae appear qualitatively similar. To quantitatively compare dimming response, control and perampanel-treated larvae were exposed to a range of dimming intensities from 2 to 60-fold and the percentage of larvae responding was measured and presented as a percentage in Figure 6c (results are from three independent assays, with 46–139 larvae per group). The percentage responding at all intensities was very similar for both groups, and pair-wise comparisons at each fold change failed to show significance. In addition, no differences were measured in the velocity or duration of swims in pair-wise comparisons of control and perampanel-treated larvae at any fold-dimming (data not shown). We conclude that there is no change in sensitivity to dimming caused by perampanel treatment, while phototaxis was completely disrupted. Finally, we also observed that the touch response was not inhibited by perampanel (data not shown), despite the presence of VGLUT-positive epidermal sensory neurons (Horie et al., 2008b). This would appear to agree with the observation that primary RNs for the PNS, the eminens cells and the AMGs do not express the AMPAR (Hirai et al., 2017; and our observations). In addition to the AMPAR, the Ciona genome contains several other glutamate receptors including one kainate and one NMDA (Okamura et al., 2005), although their expression has not been characterized.
Perampanel does not disrupt the light dimming response.
(a) Light dimming response in control larvae. Shown are 5 s (s) projections from time-lapse videos in which swims appear as lines. Left panel shows a projection 5 s before dimming, and right panel 5 s after dimming. (b) same as a, but larvae were perampanel-treated. (c) Quantification of light dimming response in control and perampanel treated larvae. Larvae were exposed to dimming of 505 nm light from 2- to 60-fold. Dimming response was scored as percent of larvae responding. Bars show averages of three independent assays ± standard deviation.
Swimming of control and perampanel-treated Ciona larvae in a directional light field.
Larvae in 10 cm petri dishes were recorded at nine frames/second. Black and white tones were inverted to make the larvae more visible. The video plays at 5X normal speed.
Dimming response of control and perampanel-treated Ciona larvae in 10 cm petri dishes.
Larvae were imaged for 70 s at five frames/second, with dimming of 505 nm ambient light at 10 s. Black and white tones were inverted, and thus the dimming appears as a brightening. The video plays at 5X normal speed.
In summary, we are able to separate the phototaxis and dimming behaviors pharmacologically. Moreover, we can identify the VACHT/AMPAR-positive RNs as essential for an excitatory PR-I circuit that involves presynaptic glutamatergic PR-Is and postsynaptic cholinergic MGINs. The number and location of the VACHT/AMPAR-positive RNs, the circuit logic, and our behavioral observations are all consistent with these being prRNs.
A disinhibitory circuit
Of equal significance to our observation that navigation is inhibited by perampanel, is our observation that the dimming response, which is mediated by the PR-IIs (Salas et al., 2018), is not inhibited by perampanel (Figure 6). Our expression studies show that the PR-IIs are comprised of a mixture of VGAT- and VGAT/VGLUT-expressing photoreceptors. Although it is formally possible that PR-IIs signal exclusively via glutamate in an excitatory circuit via a non-AMPA glutamate receptor on their RNs, our observations that several of the PR-IIs are VGAT-only, as are the majority of the pr-AMG RNs, suggests an alternative disinhibitory circuitry logic. This circuit would consist of the inhibitory PR-IIs synapsing to the pr-AMG RNs to reduce their inhibition on the cholinergic MGINs.
Implicit in the disinhibitory model is an autonomous level of motor activity in larvae that could be inhibited by the GABAergic pr-AMG RNs, and that this inhibition is released upon stimulation of the GABAergic PR-IIs. We investigated this possibility by two approaches. In the first approach, we inhibited GABAergic receptors with picrotoxin (Olsen, 2014), which should inhibit signals from the GABAergic photoreceptors and the pr-AMG RNs (and most likely the AntRNs), as well as PNS relay neurons, including the eminens cells and the AMGs. The ACINs, which are essential for the central pattern generator (Nishino et al., 2010), are glycinergic and should not be inhibited by picrotoxin. In the second approach, we took advantage of a previously described Ciona mutant, frimousse (frm) (Deschet and Smith, 2004; Hackley et al., 2013). In homozygous frm larvae the anterior BV is transfated to epidermis due to a null mutation in a neurula stage-specific connexin gene (Hackley et al., 2013). Frm larvae thus lack the ocellus pigment cell and photoreceptors, as well as the otolith, although the motor ganglion appears intact (Deschet and Smith, 2004; Hackley et al., 2013).
Hybridization chain reaction (HCR) in situ
Request a detailed protocolCiona intestinalis-type B were used for in situ studies and staged to match the animals used in the connectome study (Ryan et al., 2016). Optimized HCR in situ probes for each target transcript were obtained from Molecular Technologies. For detection of GABAergic/glycinergic cells, probes were made to the vesicular GABA transporter gene; for glutamatergic cells, probes were made to the vesicular glutamate transporter for cholinergic cells, probes were made to the vesicular acetylcholine transporter. The sequences from which the HCR probe sets were chosen were assembled from scaffold reads available through the Aniseed website (aniseed.cnrs.fr), and are shown in Supplementary file 1. The in situ protocol followed the previously published Ciona in situ hybridization protocol (Corbo et al., 1997) until the prehybridization step. At this point, the protocol follows the published HCR protocol (Choi et al., 2018), with the following exception: during the amplification stage, incubation with hairpins is performed for 3 days instead of 12–16 hr.
HCR in situ stained larvae were cleared with Slowfade Gold with DAPI (Invitrogen) and imaged on a Leica SP8 resonant scanning confocal microscope. Imaris v. 9.1 (Bitplane) was used to visualize embryos and assign centroids to nuclei using the ‘add new spots’ function, followed by manual correction when necessary. Nuclei were assigned using the maximum intensity projection, cropped to the area of interest. Volume rendering of in situ patterns was also done using Imaris v. 9.1.
Cell registration
A rotation matrix was calculated based on the 3-dimensional vectors between the anchor cells (ddN and/or antenna cells) and the center of the target cells (photoreceptors or relay neurons) using the HCR in situ (target set) and connectome cell centroids (source set). The source set was then rotated to an approximate orientation to the target set. Next, the Coherent Point Drift Algorithm was used to calculate an affine transformation matrix between the source set and the target set of cells (Myronenko and Song, 2010). This algorithm models the source set as a Gaussian Mixture Model (GMM), and the target set is treated as observations from the GMM. The transformation matrix is calculated to maximize the Maximum A Posteriori estimation that the observed point cloud is drawn from the GMM. A nearest neighbor mapping based on Euclidean distance is then used to find the closest corresponding point in the target cell set for each cell in the transformed source cell set. The implementation used was adapted from the pure Python implementation https://github.com/siavashk/pycpd. The maximum number of iterations was set to 1000 and the maximum root mean squared error for convergence was set to 0.001. The code for the registration is available as supplementary material (Source codes 1–3).
Confusion matrix
Request a detailed protocolEach dataset containing NT information was registered to every other dataset of the same type using the algorithm detailed above. The EM-registration based cell assignments of each cell in both sets is then compared to each other to see if they agree (Stehman, 1997). The confusion matrix shows the number of times a cell assignment in one dataset corresponds with each other cell assignment in another dataset.
Behavioral assays
For time-lapse videos the inverted lid of a 60 mm petri dish was first coated with a thin layer of 1% agarose. Larvae were then added to the inverted lid with filtered sea water containing 0.1% BSA with streptomycin and kanamycin each at 20 μg/ml. Finally the dish was covered with a square of glass leaving no air at the top interface. Stock solutions of perampanel were dissolved in methanol and diluted to final concentrations of either 5 μm (Santa Cruz Biotech) or 15 µM (Adooq Bioscience) in filtered sea water/BSA/antibiotics. Picrotoxin (Tocris) was also diluted in methanol and used at a final concentration of 1 mM. Control samples received methanol alone.
Time-lapse images were collected using a Hamamatsu Orca-ER camera fitted on a Navitar 7000 macro zoom lens. Programmable 700 nm and 505 nm LED lamps were used to illuminate the larvae (Mightex). All light intensity readings were taken with an Extech Instruments light meter.
Dimming-response
Request a detailed protocolAll larvae used were between 25 and 28 hpf (18°C). For image capture, the larvae were illuminated with the 700 nm LED lamp and the camera was fitted with a red filter to block the 505 nm light. The videos were recorded at five fps. In the assays, larvae were first recorded for 10 s with the 505 nm LED light mounted above the dish at 600 lux and then dimmed to specific values while image capture continued for another 3 min. Larvae were allowed to recover for 5 min before being assayed again.
Phototaxis
Request a detailed protocolAll larvae used were approximately 25 hpf (18°C). The 505 nm LED light was mounted to one side to the petri dish at approximately 3000 lux. Images were captured at one frame per minute for five hours, with the exception of 30 s capture session at 8.9 fps to assay swimming behavior.
Spontaneous Swims
Request a detailed protocolAll larvae used were between 26 and 28 hpf. The plates were illuminated with only a 700 nm LED light in order to record dark conditions. The videos were recorded at about 8.9 fps for one minute.
Behavioral data analysis
Dim-response criteria
Request a detailed protocolResponses to light dimming were counted if: (1) the larva was stationary at the time of the light dimming, and (2) it swam for longer than 3 s. Three seconds was determined by measuring the duration of tail flicks as previously described (Salas et al., 2018). Larvae that bumped or brushed against other larvae or the dish edges were not counted.
Tracking and quantification
Request a detailed protocolLarval swims were tracked using a custom MATLAB script named Estimators of Locomotion Iterations for Animal Experiments (ELIANE). Before uploading to ELIANE, time-lapse images were first processed with Fiji (ImageJ) by subtracting a minimum Z-projection to all the frames and then inverting black and white. ELIANE takes the processed time-lapse images and first creates a background image by averaging the pixels from all the frames. Next, it goes to the initial frame, subtracts the background image, and stores all remaining objects found in the specified region of interest (ROI) as initial objects. Then, analyzing one-by-one the initial objects, it goes frame-by-frame subtracting the background image and analyzing all objects to determine the new position of the object by comparing the Euclidean distances of it to all other objects in that frame. If the object had moved unrealistically fast (>6.5 mm/s), moved outside the ROI, or did not move after a set time (1 min), the object was not analyzed. This MATLAB script can be found in the Supplemental Materials (Source code 4).
The spontaneous swims in the frimousse experiment were quantified manually.
Sampling
Request a detailed protocolAssessment of larval swim parameters were performed using three independent assays. For the spontaneous swims, which were quantified manually, 25 larvae were selected randomly, starting from the center of the plate going outward, only using the ones that could be tracked for the entire minute recording session.
Tests of significance
Request a detailed protocolDimming response significance and swim frequency were calculated using the Wilcoxon rank-sum test; spontaneous swim time significance was calculated using the Student’s t-test; and the variance of spontaneous swimming significance was calculated using the F-test.
References
-
1
Fold-change detection in biological systemsCurrent Opinion in Systems Biology 8:81–89.https://doi.org/10.1016/j.coisb.2017.12.005
-
2
Network motifs: theory and experimental approachesNature Reviews Genetics 8:450–461.https://doi.org/10.1038/nrg2102
-
3
Evolution of eyes and photoreceptor cell typesThe International Journal of Developmental Biology 47:563–571.
-
4
EXP-1 is an excitatory GABA-gated cation channelNature Neuroscience 6:1145–1152.https://doi.org/10.1038/nn1136
-
5
GABAergic synaptic transmission modulates swimming in the ascidian larvaEuropean Journal of Neuroscience 22:2541–2548.https://doi.org/10.1111/j.1460-9568.2005.04420.x
-
49
Selecting and interpreting measures of thematic classification accuracyRemote Sensing of Environment 62:77–89.https://doi.org/10.1016/S0034-4257(97)00083-7
-
50
Ciliary Hovering in Larval Lancelets (=Amphioxus)The Biological Bulletin 188:231–233.https://doi.org/10.2307/1542300
- 51
- 52
-
53
Neural map of the larval central nervous system in the ascidian Ciona intestinalisZoological Science 27:191–203.https://doi.org/10.2108/zsj.27.191
-
54
Ciona geneticsMethods in Molecular Biology 770:401–422.https://doi.org/10.1007/978-1-61779-210-6_15
- 55
- 56
-
57
Shadow response in the blind cavefish Astyanax reveals conservation of a functional pineal eyeJournal of Experimental Biology 211:292–299.https://doi.org/10.1242/jeb.012864
- 58
-
59
Developmental expression of glutamic acid decarboxylase and of gamma-aminobutyric acid type B receptors in the ascidian Ciona intestinalisThe Journal of Comparative Neurology 506:489–505.https://doi.org/10.1002/cne.21565
-
60
Electroporation in ascidians: history, theory and protocolsAdvances in Experimental Medicine and Biology 1029:37–48.https://doi.org/10.1007/978-981-10-7545-2_5
Decision letter
-
Oliver HobertReviewing Editor; Howard Hughes Medical Institute, Columbia University, United States
-
Ronald L CalabreseSenior Editor; Emory University, United States
In the interests of transparency, eLife includes the editorial decision letter and accompanying author responses. A lightly edited version of the letter sent to the authors after peer review is shown, indicating the most substantive concerns; minor comments are not usually included.
Thank you for submitting your article "Parallel Visual Circuitry in a Basal Chordate" for consideration by eLife. Your article has been reviewed by Ronald Calabrese as the Senior Editor, a Reviewing Editor, Oliver Hobert, and two reviewers. The reviewers have opted to remain anonymous.
The reviewers have discussed the reviews with one another and the Reviewing Editor has drafted this decision to help you prepare a revised submission.
The reviewers – and the Reviewing Editor – agree that the manuscript reports an interesting, exciting set of findings that provide new insight into how visual systems evolve. However, there is also agreement that the evidence behind the GABA receptors being involved in the behavioral response to dimming is entirely indirect, and would be substantially strengthened by a pharmacological parallel to the Glutamate receptor antagonist data. That is, according to the disinhibition model, acute blockade of GABA(A) receptors with a pharmacological antagonist should produce a "hyperactive" movement phenotype akin to the frm mutant animal, but one that should still be capable of phototaxis (but not a dimming response). Such a result would provide an elegant "double dissociation" that would parallel the findings with the AMPA receptor antagonist.
There is also agreement that the manuscript requires an extensive revision to the Introduction that puts the work in a broader context. At present, the manuscript begins largely with a description of the Ciona connectome, in relation to other complete connectomes, and then plunges directly into a more detailed description of ganglia, cells and synapses. A broader audience could be engaged by the work if the authors identified the key question of interest, and provides some of the background material currently found in the Discussion section, before diving into the pertinent details.
Reviewer #1:
How the functional architecture of visual systems has evolved to subserve different behavioral goals is a fundamental question of broad interest. At present, while we have a deep understanding of visual system organization in a few experimental models, such a fundamental question can be enriched through the exploration of evolutionarily divergent organisms. In this context, Smith and colleagues integrate a new description of neurotransmitter expression patterns, ultrastructural connectivity, pharmacology and behavior to derive new insights into the architecture of the Ascidian Ciona visual system.
First, by mapping RNA expression patterns onto neurons spanning the Ciona nervous system using a combination of HCR in situs and image registration, they assign neurotransmitter types to many neurons. Importantly, these studies reveal three classes of ocellus photoreceptors – one that uses glutamate as a transmitter, one that uses GABA, and one that appears to release both. Next, using a glutamate receptor antagonist, they demonstrate that blockade of signaling from glutamatergic photoreceptors blocks phototaxis, but does not affect a second behavior evoked by transient dimming. Finally, consistent with the idea that a subset of photoreceptors could control the dimming response by depolarizing to darkness, and releasing GABA, the authors describe a mutant in which visual input to motor pathways is disrupted, leading to an animal that swims constitutively.
Overall, this manuscript reports an interesting, exciting set of findings that provide new insight into how visual systems evolve. I find the idea that there might be photoreceptors that appear to hyperpolarize to light and release GABA particularly exciting, and it will be fascinating to learn more about how these photoreceptors are related to retinal and pineal photoreceptors in vertebrates. However, I do feel that the evidence behind these receptors being involved in the behavioral response to dimming is entirely indirect, and would be substantially strengthened by a pharmacological parallel to the Glutamate receptor antagonist data. That is, according to the disinhibition model, acute blockade of GABA(A) receptors with a pharmacological antagonist should produce a "hyperactive" movement phenotype akin to the frm mutant animal, but one that should still be capable of phototaxis (but not a dimming response). Such a result would provide an elegant "double dissociation" that would parallel the findings with the AMPA receptor antagonist.
Reviewer #2:
The fact that there is a full map of connections in Ciona provides a great opportunity to dissect circuits. Even better, the tools are there to perform some genetic and pharmacological pertubations, and evaluate effects on behavior. This study begins to exploit these features in a study of the Ciona visual system. The authors dug deeper into two circuits that begin with photoreception. They used transgenic reporter animals and in situ hybridization to define the use of two classical neurotransmitters, glutamate and GABA. Surprisingly, one type of photoreceptor uses GABA, an inhibitory neurotransmitter not previously described as used by photoreceptors in any species. From the known connections, they also make a case for how the two circuits are connected, and further suggest that one of the circuits is disinhibitory, perhaps along with other sensory inputs, for oscillatory swimming behavior. Through the use of a specific antagonist for a glutamate receptor they are able to show that one of the photoreceptor circuits is involved with detection of the direction of light (phototaxis), using a behavioral assay. Interestingly, inhibition of phototaxis has no effect on the other circuit, which detects dimming. However, it is likely that there is cross talk between the two photoreceptor circuits, as suggested by the known anatomy.
Overall this study provides a very nice example of photoreceptor directed behavior as controlled by two different circuits. It provides food for though regarding the evolution of different types of visually guided behaviors and the use of different types of photoreceptors. Optogenetic manipulations and calcium imaging (tried by the authors but did not work due to technical limitations) would greatly add to this story, but as it stands it constitutes a very nice addition to our understanding of a sensory circuit and behavior.
https://doi.org/10.7554/eLife.44753.036Author response
The reviewers – and the reviewing editor – agree that the manuscript reports an interesting, exciting set of findings that provide new insight into how visual systems evolve. […] A broader audience could be engaged by the work if the authors identified the key question of interest, and provides some of the background material currently found in the Discussion section, before diving into the pertinent details.
In our revised manuscript we have thoroughly addressed the reviewers concerns and have included extensive new data from behavioral studies using a GABA receptor antagonist (Figure 7 in the revised manuscript, and related text). As you will read in the text, our results with the GABA receptor antagonist (picrotoxin) agree thoroughly with our disinhibition model (and with our observations of the frm mutant). The use of the GABA receptor antagonist was an excellent suggestion, and we feel that the results presented here greatly strengthen our model. As you will see in Figure 7, picrotoxin (like the frm mutant) leads to increased spontaneous swimming. Moreover, picrotoxin also leads to a dramatic reduction in the dimming response. We then show with use of picrotoxin combined with the AMPAR antagonist perampanel that the residual dimming response is due to parallel activation of the excitatory circuit. Finally, we show that picrotoxin-treated larvae are still capable of phototaxis. However, we observed that the phototaxis ability of the picrotoxin-treated larvae was somewhat dampened in comparison to controls, which we attribute to excitotoxicity of prolonged picrotoxin exposure (Movie5 documents the toxicity of prolonged picrotoxin exposure).
We have also extensively rewritten the Introduction along the lines suggested by the reviewer. Additionally, as requested, we have included in the text the number of animals tested using the pOpsin1/VGAT Kaede combination (n=5). Finally, we have collected additional data on neurotransmitter use by cells of the motor ganglion. These additional data are presented in revised versions of Figure 4 and Figure 4-figure supplement 1. Our conclusions regarding the minimal circuit are unchanged by this additional data; however, we are revising our neurotransmitter assignment to the anterior pair of ACINs. This reassignment was undertaken after consultation with Kerrianne Ryan (author of the Ciona connectome manuscript). We also include an approved personal communication from Dr. Ryan in this section.
https://doi.org/10.7554/eLife.44753.037Article and author information
Author details
Matthew J Kourakis

Funding
National Institute of Neurological Disorders and Stroke (R01NS103774)
- William C Smith
The funders had no role in study design, data collection and interpretation, or the decision to submit the work for publication.
Acknowledgements
We thank Takeo Horie and Takahiro Kusakabe for the opsin1 promoter construct; Yasunori Sasakura for the stable pVGAT >kaede line and pVACHT >CFP plasmid; Haruo Okado for the pAMPAR >GFP construct. Kerrianne Ryan for her helpful discussion and sharing unpublished data. Chelsea Parlett-Pelleriti for her advice on statistical analysis. We acknowledge the use of the NRI-MCDB Microscopy Facility and the Resonant Scanning Confocal supported by NSF MRI grant 1625770. This work supported by an award from NIH (NS103774) to WCS and BM.
Senior Editor
- Ronald L Calabrese, Emory University, United States
Reviewing Editor
- Oliver Hobert, Howard Hughes Medical Institute, Columbia University, United States
Publication history
- Received: December 28, 2018
- Accepted: April 11, 2019
- Accepted Manuscript published: April 18, 2019 (version 1)
- Version of Record published: May 3, 2019 (version 2)
Copyright
© 2019, Kourakis et al.
This article is distributed under the terms of the Creative Commons Attribution License, which permits unrestricted use and redistribution provided that the original author and source are credited.
Metrics
-
- 807
- Page views
-
- 173
- Downloads
-
- 0
- Citations
Article citation count generated by polling the highest count across the following sources: Crossref, PubMed Central, Scopus.
Download links
Downloads (link to download the article as PDF)
Download citations (links to download the citations from this article in formats compatible with various reference manager tools)
Open citations (links to open the citations from this article in various online reference manager services)
Further reading
-
- Neuroscience
-
- Neuroscience


